Components: Simple to Complex
While developing, at first, shared components was simple and clear: a few basic functions and well-structured code.
However, as the product expanded, the requirements kept increasing:
- Additional component specifications as the project grew
- Different displays required due to responsive design (RWD)
- Unique logic within different scopes, leading to various conditions
I found myself in a dilemma: every modification was confusing, as I feared changing one thing would effect another. Initially, We relied on unit tests to prevent errors. But as the component grew, the number of test cases increase rapidly. It cause the logical relationships became difficult to track.
“Have I written out all the test cases and edge cases?” became a question I frequently asked myself.
Documentation: Table to Flowchart
To solve the challenge, I tried to write a documentation to help the team with code reviews and spec alignment. In the beginning, I used table to record various conditions with their corresponding display logic, like the one below:
| Page | Type | display A | display B | display C | display D | display E |
|---|---|---|---|---|---|---|
| Landing | Type1 | ✅ | ✅ | ❌ | ❌ | if Mobile (E’✅) else ❌ |
| Admin | Type1 | ❌ | ✅ | ❌ | ✅ | if Mobile (E’✅) else ❌ |
| Type2 | ❌ | ❌ | ❌ | ✅ | ❌ | |
| Type3 | ❌ | ✅ | ✅ | ✅ | if conditionE’ (E’✅) else ❌ | |
| Client | Type1 | ❌ | ✅ | ❌ | ✅ | if Mobile (E’✅) else ❌ |
| Type2 | ✅ | ✅ | ✅ | ✅ | ❌ |
This approach initially provided some improvements by documenting all scenarios. However, several issues remained:
- Difficult to track conditional relationships: statements like “This check mark only applies when the previous three condition are met”, or “These tow conditions are mutually exclusive” were hard to convey.
- Lack of decision flow: Readers had to scan row by row, making it hard to understand logic quickly.
- Complicated to defined: Introducing new categories like “Type” to distinguish conditions added complexity.
- High information density: Adding annotations made the table harder to parse.
Why Flowcharts Work Better
Then one day, a senior engineer “translated” my table into a flowchart.
It was an eye-opening experience, complex mutually logic could be presented so clearly!
Here’s the example:
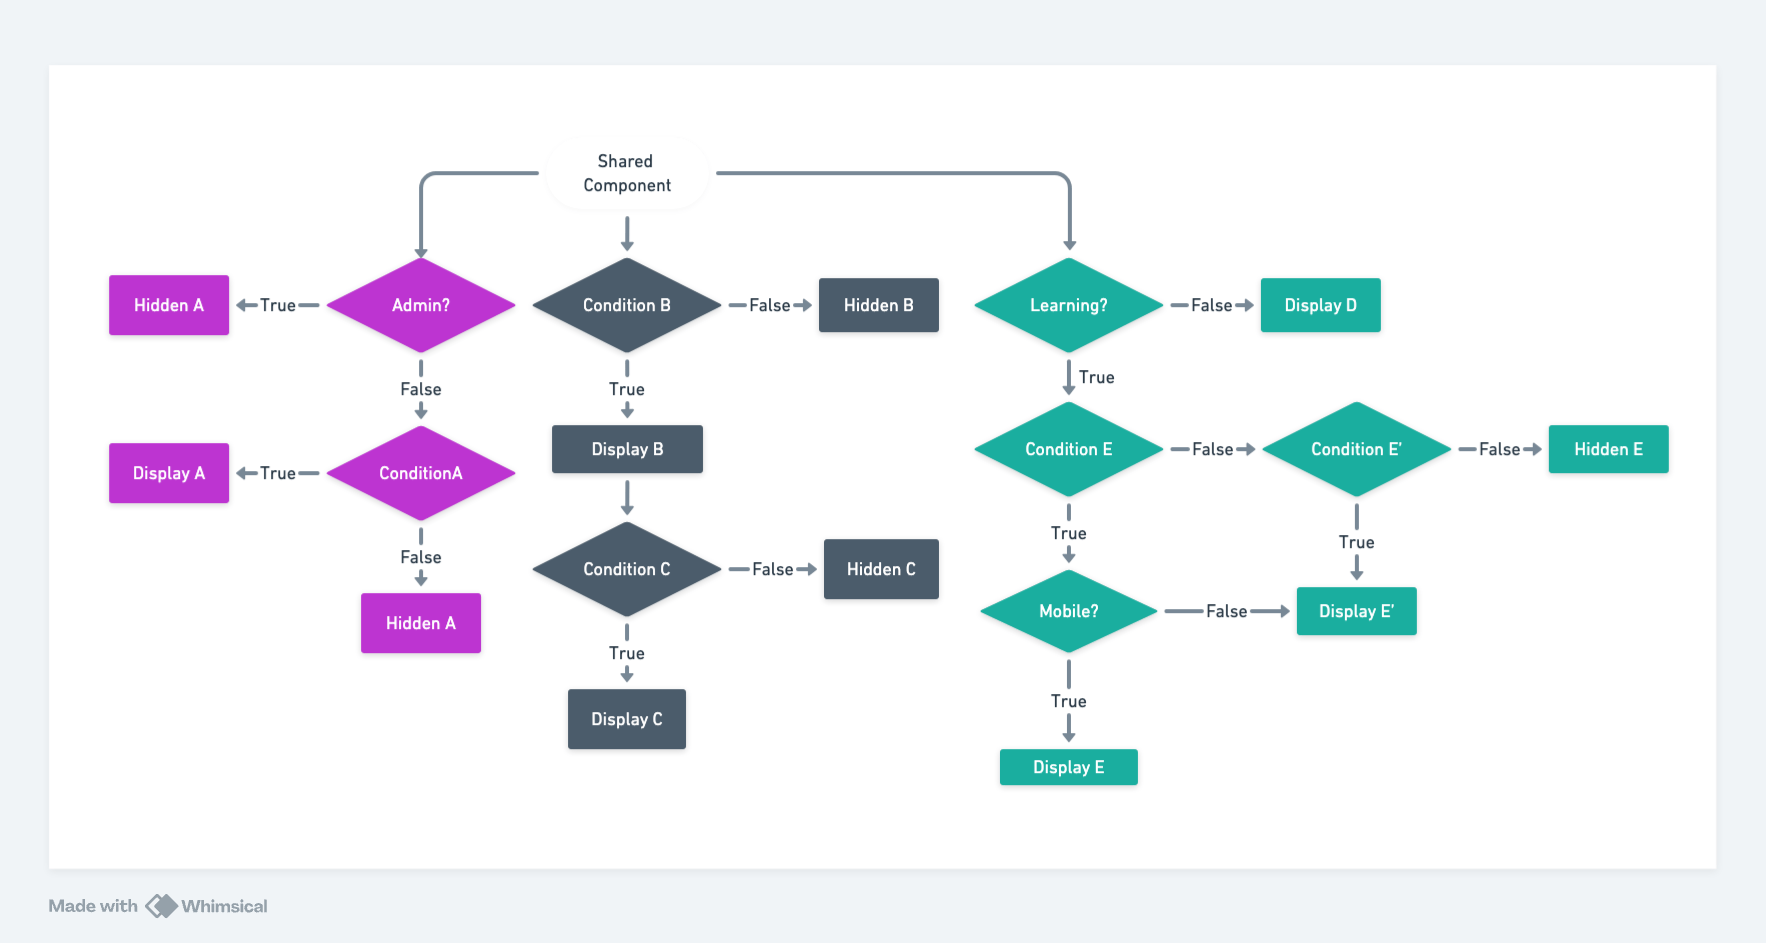
Flowcharts provided several key advantages:
- Structured Thinking: Instead of introducing artificial categories like “Type,” the diagram was built purely on logical relationships.
- Clear Decision Nodes: No need for extra annotations—each condition was explicitly mapped out.
- Intuitive Visual Representation: Unlike dense tables,, flowchart provide the spatial thinking to simplify understanding.
- Approachable Testing Strategy: By identifying all possible paths, we could ensure comprehensive test case coverage.
Conclusion
When I first learned programming, flowcharts were frequently used to illustrate logic. However, in real-world development, I overlooked this fundamental yet powerful tool until managing complexity became difficult to manage.
This experience really give me great insight: when logic becomes too complicated, step back and visualize it. A well-structured flowchart can simplify mutual relationships and make development more intuitive, efficient, and maintainable.